
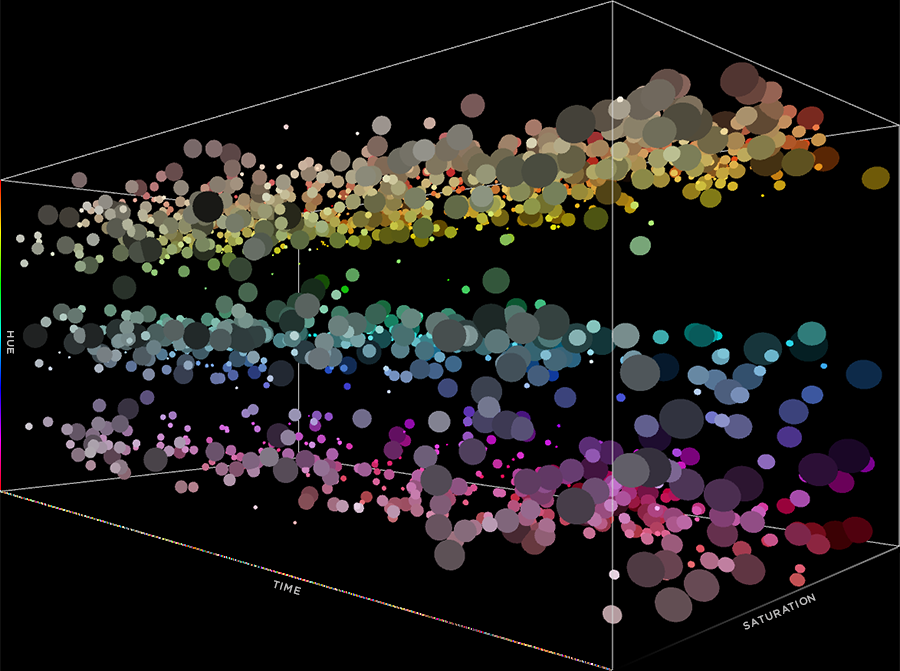
Data visualization of 5 years of Chromapost 1 April 2009 - 31 March 2014, 1826 days/colors 5 Time, Hue, Saturation and Brightness in 3D All of the colors posted over a five year period are rearranged based on time, hue and saturation in three dimensional coordinate system. X axis = time; Y axis = hue; Z axis = saturation. The size of each sphere is reversely proportionate to brightness. (Click on graphs to see the full-sized versions.) |
Map. |
 |
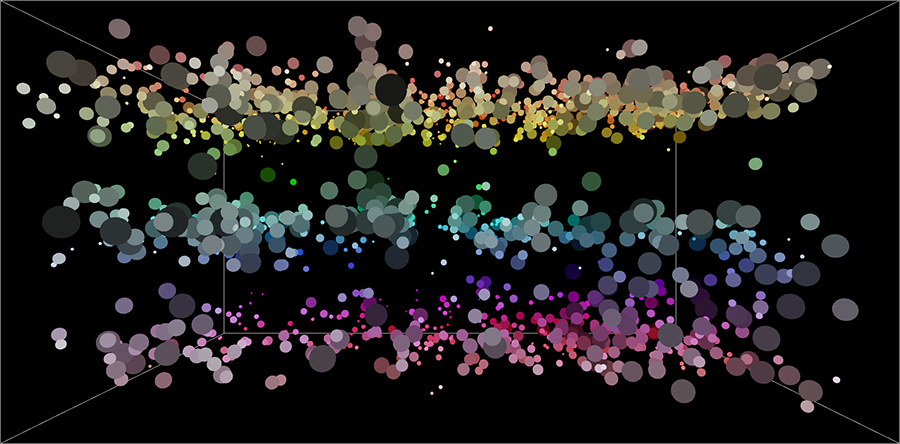
| Frontal view. |
 |
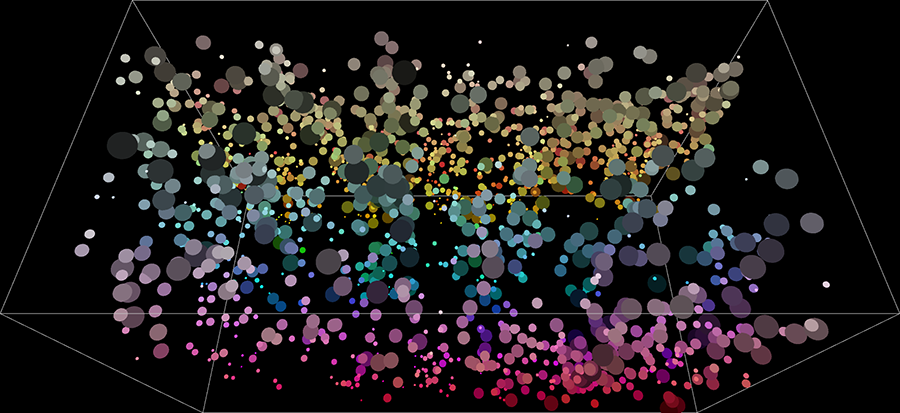
| View from below. |
 |
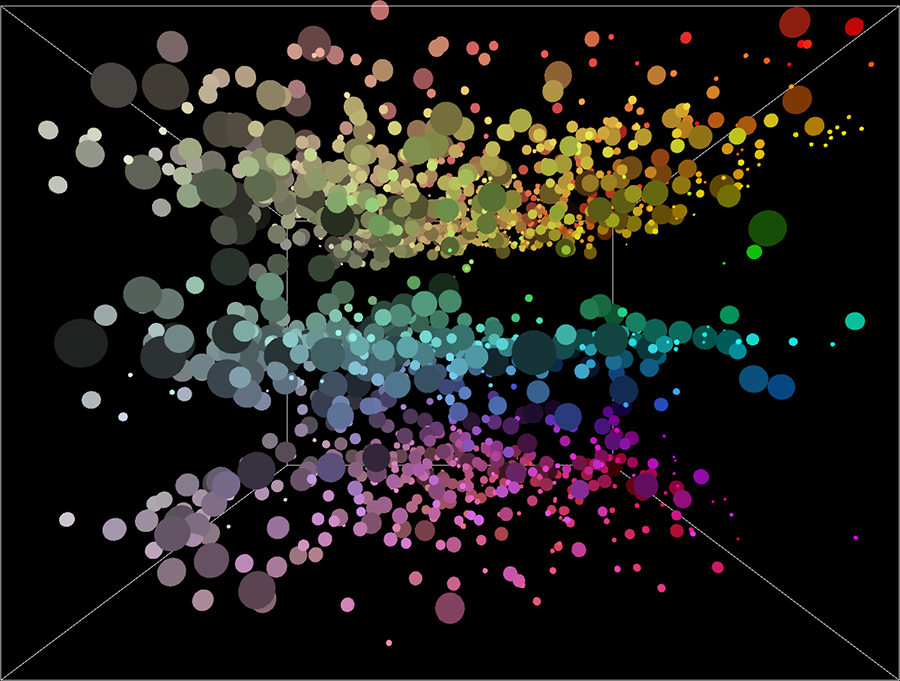
| Side view. |
 |
| Inside view 1. |
 |
| Inside view 2. |
 |